
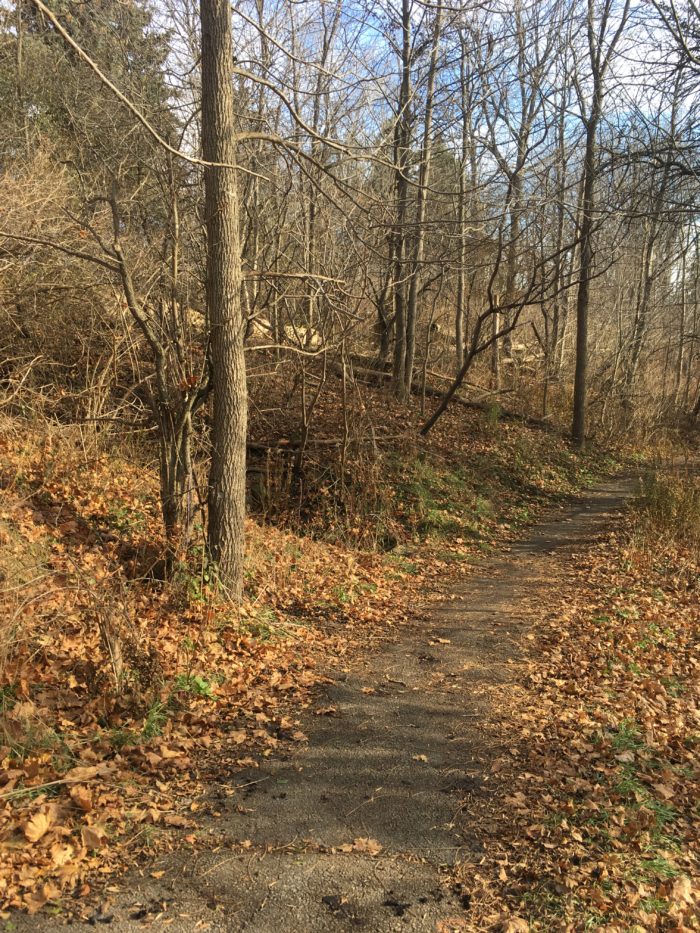
During recent Imaginative Ethnography Workshops that were a part of my Performance Ethnography course, our class was broken into small groups and sent off to explore the Black Creek Trail in search of silences. In our presentation, my group focused on our use of scores during our Black Creek Trail excursion. My own understanding of scores was limited by my disciplinary affiliation with music, and I was interested to learn that disciplines like performance art and dance also use scores as guidelines for their work. I wondered how graphic scores, used by composers and musicologists to represent music in non-standardized notation, might be used in imaginative ethnography. In this post, I will discuss three scores that I created, the scores that influenced them, and how they can be variously applied as methods within an ethnographic methodology. By doing so, I hope to spark the imagination of others who might be interested in applying this method to ethnographic methodology.
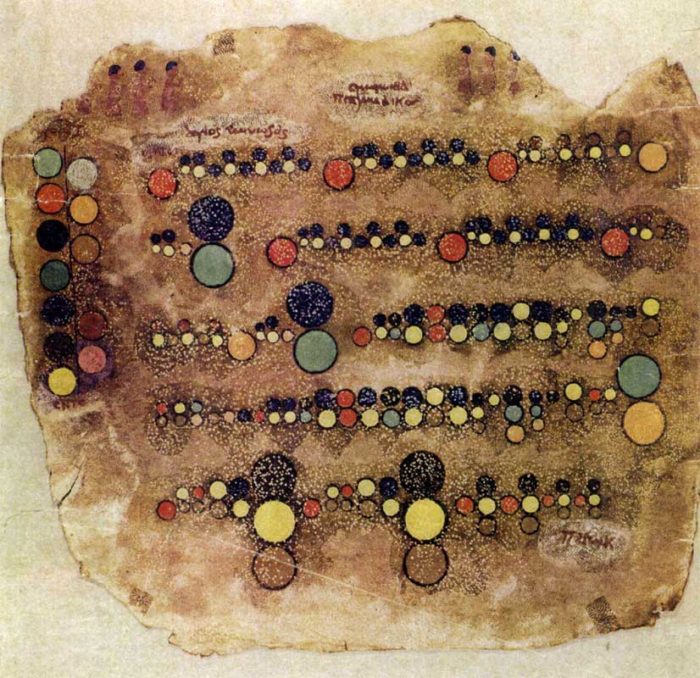
First, here is a brief history of graphic scores as used within the discipline of music. Western music history situates graphic notation in mid-twentieth century America (Kennedy and Kennedy), as part of a post-war radical leftist artistic expression akin to Dadaism. There is no doubt that composers of this era made the practice of non-standardized music notation popular; their use of non-standardized notation was a reaction against a standardized notation whose acceptance was near universal and dated back centuries. As such, it was quite controversial and influential. Theresa Sauer notes that many of the contemporary composers whose graphic scores are included in her anthology Notations 21 were inspired by John Cage’s 1968 book Notations. While popularized by Cage and others of his time, graphic notation does not begin in 1950s America. In the fourteenth and fifteenth centuries, for instance, French composer Baude Cordier notated music in the shape of hearts and circles (Alvira). Further, Halim El-Dabh, an Egyptian-American composer, describes a photo of an ancient Egyptian parchment containing circles of various sizes and colours he found in a September 1, 1952 issue of Vogue. El-Dabh understood it to be a musical score immediately due to his music-related synesthesia, which causes him to hear colours. This was confirmed for El-Dabh by the writings of musicologist Hans Hickmann, suggesting that graphic notation has roots in much earlier civilizations. Finally, dance notation is often graphic, and dates to well before the 1950s. It could, in fact, be argued that many graphic scores by music composers involve an element of choreography. One example of this can be seen in the work of Earle Brown, one of four composers in the New York School that also included Cage. Kyle Gann observed Brown conducting many of his works and states, “As evocative as [Brown’s] scores [look], there is a gap between them and the sound of his music that was filled in by his own performances” (xvi). Gann wonders if Brown’s scores are partially dance scores written for himself, arguing that Brown’s gestures “turned orchestras into huge acoustic theremins” (xvi) and may have had a larger effect on the performers than the score he created for them to read. Another example of a hybrid dance/music score is John Cage’s 49 Waltzes for the Five Boroughs, which is discussed in length below. While composers like Cage popularized graphic notation, its history is global, ancient, and interdisciplinary.
Second, I offer the reader a theoretical definition of music that will inform my presentation of the graphic scores to follow. While I consider these scores (and the scores of the composers I reference) to be musical, they are not necessarily realized with instruments or organized pitches, tempos, dynamics, or other qualities. I take my definition of music from the work of Christoph Cox, a philosophy professor at Hampshire College (Hampshire College). Cox quotes John Cage, who states “Music is continuous; only listening is intermittent” (155). He also cites Cage’s work 4’33”. In this piece Cage asks the performer to make no noise for the entire duration, requiring them to turn pages at specific moments. William O. Beeman argues that in 4’33”, Cage redefines “the relationship between music, the figure and everyday life, the ground against which music is played” (31). Cox takes this further, suggesting that composers are curators (not creators) of a sonic flux, and that Cage is appropriating sounds from what Deleuze calls “a continuous acoustic flow… that traverses the world” (155).
Cox’s understanding of composers as curators removes human agency as a requirement for musical creation. He cites Nietzsche, stating that “matter itself is creative and transformative without external agency, a ceaseless becoming and overcoming that temporarily congeals into forms and beings only to dissolve them back into the natural flux, an ‘eternal self-creating’ and ‘eternal self-destroying… monster of force, without beginning, without end’” (152). This materialist perspective resists the privileging of human experience. It also resists what Dara Culhane calls “the conventional western sensory hierarchy that recognizes only five senses, conceptualizes each as separate and distinct, and considers sight as the privileged source of legitimate knowledge” (15). Cox argues that while sounds are often considered qualities of visual objects in western thought – “the sound of a bird, the sound of an air conditioner” – they are in fact “sonorous events” which “are not bound to their sources as properties” (156). It is with this materialist perspective that I present the following graphic scores and offer possibilities for their use in ethnographic inquiry.
1. John Cage and Graphic Scores as Research
John Cage’s 49 Waltzes for the Five Boroughs appeared in the October 6, 1977 issue of Rolling Stone. This issue was dedicated to the magazine’s move from San Francisco to New York, and featured New York artists and a cover design by Andy Warhol (Gillespie 4). The piece’s graphic score does not instruct musicians to play instruments in any specific way. Rather, in the vein of 4’33”, it depicts the environmental sounds often considered background in musical performances as music (Beeman 30). The score shows the 1977 Hagstrom map of the five boroughs, overlaid with coloured lines that each connect three addresses in the five boroughs. Since waltzes are in 3/4 time, the groups of three locations represent the three quarter notes in each measure of a traditionally notated waltz. As with most of his works, Cage let chance determine qualities of the score. In this instance, he used the “I-Ching” software he developed with collaborator Andrew Culver to randomly determine each location (Gillespie 4).
Don Gillespie, Cage’s publisher at C. F. Peters and a longtime friend, realized 49 Waltzes on DVD to honour Cage posthumously (Brandt 14). Along with video artist Roberta Friedman and fellow C. F. Peters’ employee Gene Caprioglio, he recorded the three locations in each of the 49 Waltzes using a rotating camera. This was the first attempt to fully realize Cage’s score (Gillespie 5). While a five minute “noise assemblage” appeared on a 1981 compilation CD, Gillespie calls the attempt “utter nonsense” and goes on to say that “no one had visited Cage’s specific locations, much less harvested the sounds that might be found there” (Gillespie 4-5).
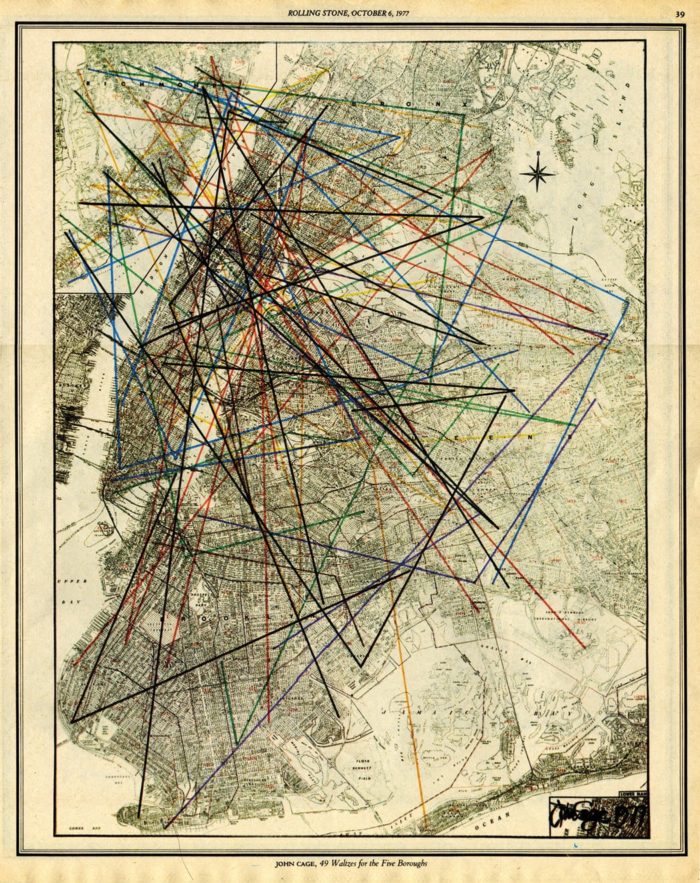
Having spent a year filming a performance of the score, Gillespie notes that the random nature of the score created frustration. For instance, due to the chance-determined natured of the addresses, an inordinate number of locations were on Staten Island (Brandt 14). Further, many of New York’s most well-known landmarks, like “the New York Harbour, the Rockefeller Center, the UN Building and many other[s]” (Gillespie 5) cannot be seen from any of the waltz locations. Gillespie also notes that he had Culver use the “I-Ching” software he developed with Cage to assign random durations to the 147 locations. This chance-based operation honoured Cage’s methodology. To the frustration of the filmmakers, these time constraints meant that many conventionally interesting places were given shorter durations, while many more ordinary locations were given lengthy ones (Gillespie 5). The version of the city that people see in the DVD version of 49 Waltzes is not the one found in tourist literature or one associated with any one person’s understanding of New York. In the words of Brian Brandt, “Viewed with an open mind, the 49 Waltzes causes you to look at and notice places and things that you would normally not think twice about. If you can let yourself go, you will take a journey through New York that Cage loved – and his score brings you not to its beloved sights but to unknown and overlooked locations” (Brandt 14).
Alexandrine Boudreault-Fournier discusses Alyssa Grossman’s film Lumina Amintirii in her chapter “Recording and Editing” in A Different Kind of Ethnography. She notes that in one scene, Grossman films people sitting on park benches by strapping her camera to a bicycle (Boudreault-Fournier ch. 4). As I walked on the Black Creek Trail during our first workshop, I was reminded of this film. I began to think of the path we were on, as well as the one Grossman filmed, as what Robin Bernstein might call “scriptive thing[s]” (Schweitzer 150). These paths choreograph our movements the same way a script (or score) might. In our second and third workshops, I (along with others) noticed that lots of the media collected by our classmates were very similar. I wondered if the concrete path, the water, the trees, squirrels, and signs choreographed our movements. I argue here that a graphic score like Cage’s 49 Waltzes might act as a #silentresistance to such choreography.
To demonstrate this, I created my own graphic score inspired by Cage’s work called 7 Waltzes for Black Creek Trail. Using a free random point generator on the internet, I created a list of 100 random points within a rectangular area surrounding the Black Creek Trail where we walked during our workshop. I organized the first 21 of these numbers into seven waltzes. I then used a random time generator to assign durations (modelling my list after Gillespie’s I used times between 16” and 3’44”) to each of the 21 locations. Finally, I used Google’s experimental software Fusion Tables to plot my waltzes on a colour-coded map. By hovering over each marker, viewers can see how long they are meant to stay at each location.
Cage’s 49 Waltzes and my 7 Waltzes are hybrid dance/music scores. They choreograph the body in ways that resist the flow of concrete and water. The points generated by the map place the performer at the Aviva Center, the man-made Stong Pond, residential areas west of the Black Creek Trail, a large apartment building, and forested areas as well as locations directly on the trail. This gives the performer a varied perspective on the trail using unconventional navigation. It also allows performers to consider various silences, including that of water on York University’s campus. The performers of these scores do not play instruments, but rather listen to silences, sounds that we often overlook. Some of these sounds might include noise pollution like airplane engines, the sound of water whose flow has been redirected by humans (underground water can be heard through manholes, and the Black Creek can be heard flowing under concrete bridges), the sounds of animals that live in predominantly human environments, the sound of crunching leaves when someone walks off the concrete path, or the sound of plastic bags stuck in trees being moved by the wind.
Within ethnographic work, scores like these could be used in the walking ethnographic methods described by Christina Moretti and Andrew Irving (Irving 23; Moretti ch. 5); while both anthropologists encourage improvised walks that spur the guide’s emplaced memory and imagination, a choreographed waltz might lead to different experiences of the city. Specifically, such choreography might spur the imagination of the guide and ethnographer while using a new materialist perspective to resist paths, sidewalks, and other flows of human power. Another application of such scores has been demonstrated by Randy Gibson and Oscar H. Scott. The pair created a website on which users can upload media of themselves at the various locations of 49 Waltzes around New York. This effort digitizes the graphic score, allowing visitors to view random waltzes or locations near them. This application could easily be applied for digital ethnography work.
2. Makoto Nomura and Graphic Scores as Transcription
About two-thirds of the way through our walk on the Black Creek Trail, our group performed a score created by one of our members, Esteban Donoso. This score involved using small circular lenses fashioned out of black paper to view our environment in different ways for about ten minutes. We could focus, zoom, pan, and do many other actions that one can do with a camera, though the only recording that was made was within our own imaginations. In Boudreault-Fournier’s words, which recall Actor Network Theory, “The camera is never detached from the anthropologist-with-a-video-camera [or actant]; it moves along with researchers as they explore various places and it becomes somewhat part of their identity” (Boudreault-Fournier 14). To realize our “films,” Donoso had us sit, close our eyes, and recollect our experiences with the lenses. This resulted in what Donoso called an “auditory film.” We spoke contrapuntally, our voices overlapping and influencing each other’s memories and imaginations (Palumbo et al.). We imitated sounds we heard, described fragmented scenes we had “recorded,” and posed questions that had been brought to our minds through this discussion. Donoso considers this auditory film part of Arjun Appadurai’s (and perhaps Benedict Anderson’s) practice of “collective imagination” (Palumbo et al.). In “Disjuncture and Difference in the Global Cultural Econonmy,” Appadurai argues that imagination plays an important role in the shaping of individual and group identities in an increasingly globalized world, and that ethnography must embrace the imagination as an important component of social life (5).
Makoto Nomura, a Japanese composer born in 1968, has created a method of collaborative improvisation reminiscent of Donoso’s auditory film. Called “Shogi Comopsition,” This method is recommended for three to five players. Makoto states that the method is “a recipe of collaborative composition among various people with different musical backgrounds,” and goes on to say that “It is just like playing cards around a table. A few players around a table compose short passages one after another instead of playing cards.” In this method of collaborative composition, performers compose in real time in response to what others have written/played before them. After the first person composes a phrase, they write it in a colour that identifies them on the score. Then they continue to play the phrase while the next person adds their own contribution in their own colour. This process continues until the paper is full (Sauer 167).
Inspired by Nomura’s method of Shogi Composition, I created a partial transcription of our auditory film. I assigned each contributor to the auditory film their own colour, and marked times beside each thought that I transcribed (one for each contributor in this initial experiment). This is not a verbatim transcription, however. Instead, it is an imaginative one. When a certain phrase stood out to me, I used online software called Wordificator to fashion an image out of the words in the phrase. This part of my score was influenced by Stephen Montague’s score for Kristallnacht, which tells the story of the Nazis smashing Jewish storefront and residential windows in 1938. Montague represents this violence by having four wine glasses smashed onstage. His score for the performance includes words in the shape of wine glasses, a method he calls “graphic/text scores” (Sauer 155).
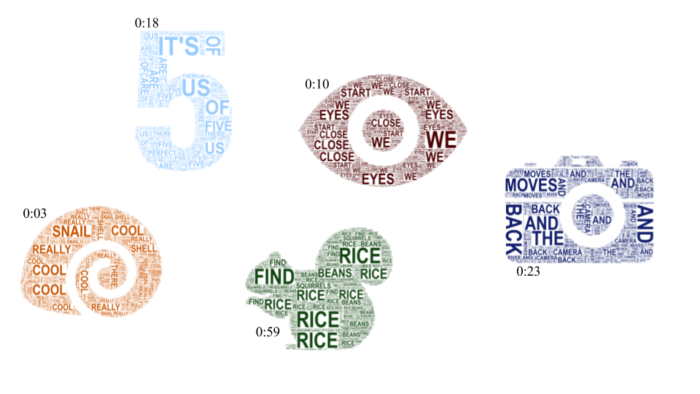
In her book Doing Sensory Ethnography, Sarah Pink argues, “The analysis itself should be situated in relation to the phenomenological context of the production of the materials. This means treating the materials themselves as texts that can be evocative of the processes through which they were produced” (121). Here Pink stresses that interacting with media obtained during ethnographic work allows for imaginative reencounters of the ethnographic place. My graphic transcription highlights this imaginative reencounter by focusing on salience instead of accuracy. In fact, the transcription I created mimics the auditory film itself. While recording, we were unable to hear every word that was being said. Instead, we spoke and listened contrapuntally and fragmentally. My transcription is similarly contrapuntal and fragmented. Thus, “the analysis is situated in relation to the phenomenological context of the production of the materials” (121). Further to this, my graphic transcription demonstrates my bias as a listener and allows for transparency in the transcription process. Instead of listening to a recording countless times to revise and add to a single accurate transcription, I could create graphic transcriptions based on what was salient to me during each listen. In the end, I would have a chain of transcriptions that transparently demonstrate my analytic process.
Nomura’s graphic scores could also be applied to other aspects of ethnographic work. For instance, what if the creation of the transcription occurred simultaneously to the interview or collective imagination exercise? As in Shogi Composition, interlocutor(s) and ethnographer(s) could each add their own thoughts to a paper, one after the other, in their own colour. Filling the page, they would have a transcription that was made during the ethnographic encounter. This method allows all participants to be involved in transcription, which could be published without the need for revision by the ethnographer.
3. Iannis Xenakis and Graphic Scores as Multisensorial
As alluded to earlier, the sensorial turn in ethnography involves resisting western scholarship’s hierarchy of the senses that privileges sight above all others. Tim Ingold argues that this resistance should involve understanding “perception as multisensory, in that the senses are not separated out at the point of perception” (Pink 15). Multisensory perception does not privilege sight, but rather sees the senses as entangled (Culhane ch. 3). They are not separate, but inform each other to various degrees and help us perceive our environment as emplaced beings. Emplacement, Pink states, “attends to the question of experience by accounting for the relationships between bodies, minds, and the materiality and sensoriality of the environment” (25).
Graphic scores are often multisensorial, allowing sights to be translated into sound or vice-versa. For instance, Brett Boutwell notes that Morton Feldman, another of the New York School composers, was concerned with notation’s “artificial rendering of sound into sight and time into space” (532). A lover of abstract-expressionist art, Feldman wanted his music to represent time as it did in his favourite paintings: “merely ‘breathing… rather than marching inexorably forward” (563). Feldman attempted to merge visual art’s metaphorical time and music’s representational space in his scores. At various points in his career he notated his music on graphs, represented the duration of a note by its physical length on a score, and used grace notes – notes that typically ornament another note and have no independent temporal quality – in lieu of other notes. Boutwell argues that for Feldman, the score was not simply a guide that led to performance. It was a visual performance in itself, and he was its performer (533).
More recently, jazz guitarist Fred Frith used photographs he took that used naturally occurring patterns of lines, stones, and wood to create graphic scores for his work Stone Brick Glass Wood Wire. Frith wrote instructions to accompany each photo score, and performed them with ensembles as group improvisations. For instance, the photo below is Frith’s score for “Dry Stone II.” Here are the instructions that accompany the score:
Any instruments. Time left to right and bottom to top. Three sections, three lines in each. Each stone is a solo, each solo begins sharply accented and loud. Soloists cued by conductor. When new stone/solo begins, previous soloists repeats his/her last (short) phrase over and over again, either until the end of the section or until cued to start a new solo. The repeated phrase should get quieter and quieter. After the form has been thoroughly learnt, soloists can also begin to work on interpreting the stones in as consistent a way as possible! Duration: c. 6.00 (Frith).
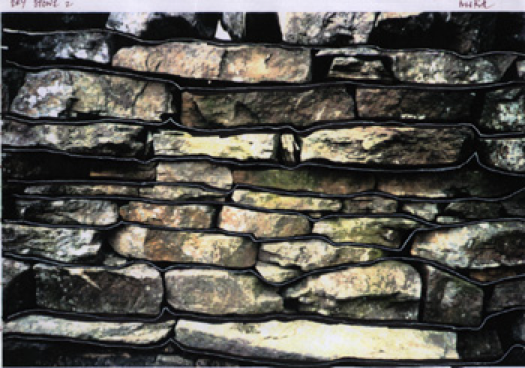
Frith’s final instruction on interpreting the stones consistently encourages multisensory engagement with the photo score; will the performers choose to interpret colour as pitch, or will they choose to interpret the texture of the rocks? Might they focus on the play between light and dark in the image, or perhaps add more notes to the solo when the stone is thicker?
My chief inspiration for my own multisensory score, however, was Iannis Xenakis. A composer and architect from the same era as the composers of the New York School, “Xenakis personified the political and social struggles of post-war Europe more intensely than any other composer” (Philip Clark 191). He combined his love of engineering and music throughout his career, notably in his design for the architect Le Corbusier’s exhibit at the Brussels World Fair in 1958 (Clark 192). Here Xenakis translated the notation for his orchestral work Metastasis into hyperbolic paraboloids that twisted concrete “into dramatic airborne spirals” (Clark 192). In this work, Xenakis plays with space and time like Feldman, creating an architectural score that people could walk through.
The multisensoriality of Xenakis’ work also included software development. The composer created UPIC, a software platform that used a stylus to control synthesizers that essentially allowed users to draw music and play shapes. A more recent software based on Xenakis’ work is IanniX, in which users can use images, video, drawings, or data to create scores. IanniX could even be used to play 49 Waltzes, Stone Brick Glass Wood Wire, or any number of other graphic scores if a user imported the images and defined rules. The software is free and open-source, and users can input code to create complicated scores if desired. Fortunately, it also has user-friendly “drag and drop” functionality for those of us without the necessary technical ability.
My own rudimentary IanniX score creates music out of a photo that I took during our initial workshop. The photo shows a pretty shell among branches, leaves and grass. I loaded the photo into Iannix and had fun inputting triggers that play sound as a cursor travels along lines I created to outline various shapes in the image. Then I used the score to play a virtual instrument in Logic, a digital audio workstation I use for composition on my computer. In this way, I was able to create a multisensory score that translates the image I input into sound. There is a tactile component to this score; I drew the lines myself, carefully following the outlines of various shapes in the image. Denielle Elliott notes, “Drawing what we see and experience during fieldwork and research requires a different sort of attention to the world, one that is affective and sensorial in its demand to take notice of the subtle and not so subtle corporeality of everyday life” (ch. 2). My sensorial analysis of the photo through drawing and composition caused me to remember our workshop, engaging in Pink’s imaginative reencounter. I took the photo because it created a pretty image on my iPhone’s viewer. I noticed while drawing the score, however, that I had zoomed in close enough to erase the human intervention in the shell’s environment. The photo did not contain the concrete, steel, signs or flotation devices that were all nearby, and I had carefully avoided the inclusion of garbage that proliferated just beyond the lens’ reach.
After using IanniX and considering Frith’s scores, I began to wonder about creating scores emplaced in nature. Pink quotes Steven Feld, who described his recording Voices in the Rainforest this way: “the idea is to have sound raise the question about the indexicality of voice and place, to provoke you to hear sound as place making” (144). What about using textural elements other than paper or digital images to create a score? How does a clarinet play concrete or steel, and how does that differ from a clarinet playing grass or water? How about performing a score made from elements found on the Black Creek Trail? How does this create an imaginative reencounter, especially if the emplaced performer is at the site? What about a score that engages the olfactory sense? How do you play the smells of pine, garbage, or stagnant water, and how do you notate these scores? Such experiments could fire the imaginations of ethnographers and interlocutors, creating interesting dialogues in the often-overlapping categories of score creation, performance and analysis.
Jennifer Walshe’s graphic score for her word This is Why People O.D. on Pills / And Jump from the Golden Gate Bridge is multisensorial, emplaced, and experiential. The score includes images of skateboarders in action, as well as directions for the 1-10 soloists performing it (Sauer 269). Walshe instructs the performer to learn how to skateboard and learn about skateboarding by watching those who are better, visiting skate parks and researching skateboarding. She then asks performers to imagine a line they wish to skateboard, and to skate that line on a pitch.
Every micro-detail of the pitch (tuning, timbre, dynamic, envelope, consistency, colour, texture, weight, feel, pressure, clarity, strength) should correspond absolutely to the experience of skating the path in your head. Pay attention to every minute detail, the micro-cartography of the path you are skating, the tiny shifts in muscle, weight, speed, direction. Carve through air in long, sweeping paths with the sound you produce. Reveal and inhabit new spaces, smooth new lines” (Sauer 269). There is almost no translation necessary in turning such a score into an ethnographic method. Further, it is explicitly multisensorial and emplaced.
4. Conclusions
My experiences in researching, analyzing and creating graphic scores has led me to believe that they are an effective ethnographic method for the often-overlapping categories of ethnographic research and analysis. Graphic scores can be used in myriad ways by ethnographers, and I only offered a few of these possibilities here. Boudreault-Fournier summarizes the criticisms levelled against ethnography in the 1980s, putting them into three broad categories (ch. 4). First, she argues that ethnography should be polyphonic. By this she means that the work should containing multiple voices, not that of the ethnographer alone. Potential for this exists in many applications of graphic scores, including Nomura’s Shogi technique. Second, Boudreault-Fournier explains that ethnography should be fragmented. Here she refers to the need for ethnographers to embrace incompleteness and partial truth. This is easy to find in graphic scores, as they are a non-standard reaction to standardized musical notation. An example would be Cage’s 49 Waltzes, which offers no explanation as to how it should be performed, and does not claim to demonstrate a complete picture of New York. Finally, she discusses the need for reflexivity in ethnography – a making of the ethnographer’s position in the ethnographic enterprise explicit. Within graphic scores, the positionality of the ethnographer comes through in their artwork, their explanations, and the multiple outcomes for performance. Each time a piece is performed, especially if it is performed by someone new, the positionality of the performer changes. This brings new meaning to the score and allows for critique. I hope to continue working with graphic scores and thinking critically about new ways they could be used at any point in the imaginative ethnographic process.